Chaos Theory
Mandelbrot Set
See the wikipedia page on the Mandelbrot Set
First a couple imports:
import cats.implicits._
import spire.algebra.Field
import axle._
import axle.math._
Define a function to compute the Mandelbrot velocity at point on the plane (x, y)
implicit val fieldDouble: Field[Double] =
  spire.implicits.DoubleAlgebra

val f: (Double, Double, Double, Double) => Int =
  (x0: Double, x1: Double, y0: Double, y1: Double) =>
    inMandelbrotSetAt(4d, x0, y0, 1000).getOrElse(-1)
Import visualization package
import axle.visualize._Define a "velocity to color" function
val colors = (0 to 255).map(g => Color(0, g, 255)).toArray

val v2c: Int => Color =
  (v: Int) => if( v == -1 ) Color.black else colors((v*5) % 256)
Define a PixelatedColoredArea to show a range of the Mandelbrot Set.
val pca = PixelatedColoredArea[Double, Double, Int](
  f,
  v2c,
  width = 500,
  height = 500,
  minX = 0.25,
  maxX = 0.45,
  minY = 0.50,
  maxY = 0.70)
Create PNG
import axle.awt._
import cats.effect._

pca.png[IO]("docwork/images/mandelbrot.png").unsafeRunSync()
Some other parts of the set to explore:
val pca = PixelatedColoredArea(f, v2c, 1600, 1600, 0d, 1d, 0d, 1d)

val pca = PixelatedColoredArea(f, v2c, 1600, 1600, 0d, 0.5, 0.5, 1d)

val pca = PixelatedColoredArea(f, v2c, 1600, 1600, 0.25d, 0.5, 0.5, 0.75d)
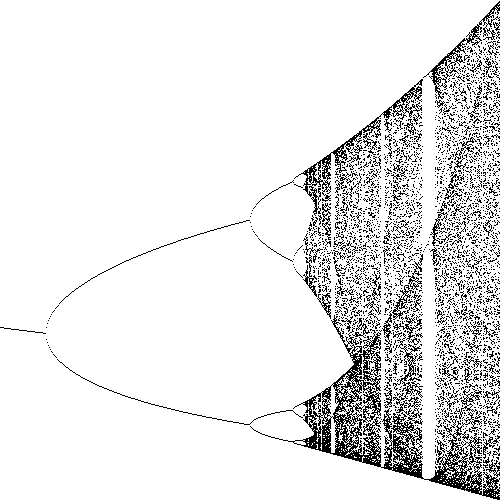
val pca = PixelatedColoredArea(f, v2c, 3000, 3000, 0.20d, 0.45, 0.45, 0.70d)Logistic Map
See the wikipedia page on Logistic Map function
Create data for a range of the logistic map function
import spire.algebra._

val initial = 0.3

import java.util.TreeSet
val memo = collection.mutable.Map.empty[Double, TreeSet[Double]]
implicit val ringDouble: Ring[Double] = spire.implicits.DoubleAlgebra

def lhsContainsMark(minX: Double, maxX: Double, maxY: Double, minY: Double): Boolean = {
  val λ = minX
  val f = axle.math.logisticMap(λ)
  val set = memo.get(λ).getOrElse {
    val set = new TreeSet[Double]()
    axle.algebra.applyForever(f, initial).drop(10000).take(200) foreach { set.add }
    memo += minX -> set
    set
  }
  !set.tailSet(minY).headSet(maxY).isEmpty
}
Define a "value to color" function.
import axle.visualize._

val v2c: Boolean => Color =
  (v: Boolean) => if (v) Color.black else Color.white
Define a PixelatedColoredArea to show a range of Logistic Map.
import cats.implicits._

val pca = PixelatedColoredArea[Double, Double, Boolean](
  lhsContainsMark,
  v2c,
  width = 500,
  height = 500,
  minX = 2.9,
  maxX = 4d,
  minY = 0d,
  maxY = 1d
)
Create the PNG
import axle.awt._
import cats.effect._

pca.png[IO]("docwork/images/logMap.png").unsafeRunSync()